- +234 70 4149 7660
- info@ekundayoeduconsult.com
- Lagos Nigeria
Data Analysis Excel SPSS
ESSENTIAL IT AND PRODUCTIVITY SKILLS.


(Analyzing COVID-19 cases in Nigeria – Dec. 22, 2020, Using Excel)
(Can you imagine yourself visualizing your Data with Excel using this)
(How to Create Scatter Plot in SPSS)
How to Create Cross Tabulation analysis in SPSS)
(How to Create Scatter Plot in SPSS)
How to Create Cross Tabulation analysis in SPSS)
(One of the challenges most SPSS users have is entering questionnaire responses (data).
(How to Create Frequency Distribution and Histogram in SPSS)
(Calculating percentage with across cells with Excel formula)
Auto convert Fahrenheit to Celsius across cells in Excel)
(Coding Ordinal variables in SPSS)
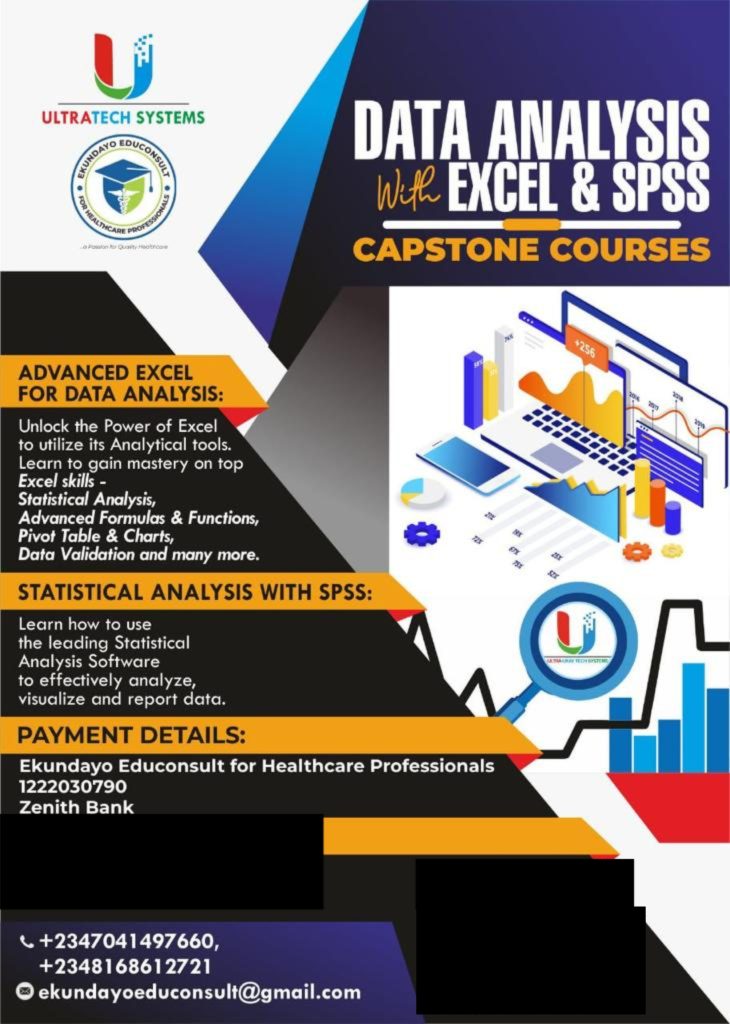
PAYMENT AND REGISTRATION DETAILS
Company’s Account
1222030790
Zenith Bank
Ekundayo Educonsult for Healthcare Professionals.
Domiciliary Account
3184967233
First Bank of Nigeria
Mustapha Yusuf Ekundayo
For International Students
Any of the options below can also be used
– Western Union
– Money gram
– World Remit
– Mukuru, etc
Send proof of payment through our WhatsApp Chat Icon visible on every page
Data Analysis with Excel and SPSS (Individual Package)
Data Analysis with Excel and SPSS (Complete Package)
Data Analysis with Excel and SPSS: A Dual Approach to Insights
Data analysis is the backbone of informed decision–making in various industries, from healthcare and education to finance and marketing. Microsoft Excel and SPSS (Statistical Package for the Social Sciences) are two of the most powerful tools for data analysis, each offering unique features to process, analyze, and visualize data.
This guide explores how to effectively use Excel and SPSS for data analysis, highlighting their strengths, applications, and integration possibilities for comprehensive analytics.
1. Why Use Excel and SPSS for Data Analysis?
1.1 Excel: The Versatile Spreadsheet Tool
- Ease of Use: Excel is intuitive and widely available.
- Data Handling: Suitable for managing large datasets with advanced functionalities like pivot tables and formulas.
- Visualization: Offers a variety of charts, graphs, and dashboards.
1.2 SPSS: The Statistical Powerhouse
- Advanced Statistics: Ideal for complex statistical analyses, including regression, factor analysis, and hypothesis testing.
- User-Friendly Interface: Menu-driven approach makes it accessible for non-programmers.
- Reliability: Preferred for academic research and professional projects requiring robust statistical tests.
1.3 Combining Excel and SPSS
- Excel excels in data preparation and preliminary analysis, while SPSS offers depth in statistical testing and modeling. Together, they create a powerful analytical workflow.
2. Key Features of Excel for Data Analysis
2.1 Data Cleaning and Preparation
- Remove duplicates and filter datasets.
- Use Text to Columns and Flash Fill to format data.
2.2 Formulas and Functions
- Statistical Functions: AVERAGE, STDEV.P, MEDIAN.
- Logical Functions: IF, AND, OR for conditional analysis.
- Lookup Functions: VLOOKUP, HLOOKUP, and XLOOKUP for retrieving specific data.
2.3 Data Visualization
- Charts: Create bar graphs, line charts, scatter plots, and pie charts.
- Conditional Formatting: Highlight trends and outliers using color scales and data bars.
- Slicers and Dashboards: Add interactivity to your data presentation.
3. Key Features of SPSS for Data Analysis
3.1 Data Import and Management
- Import data from Excel, databases, or text files.
- Define variable properties like data type, labels, and missing values.
3.2 Statistical Tests
- Descriptive Statistics: Generate summaries like mean, median, and standard deviation.
- Inferential Statistics: Conduct t-tests, ANOVA, chi-square tests, and regression analysis.
- Multivariate Analysis: Explore factor analysis, cluster analysis, and discriminant analysis.
3.3 Syntax and Automation
- Use SPSS syntax for automating repetitive tasks and ensuring reproducibility.
3.4 Visualization
- Generate detailed plots, histograms, and scatterplots.
- Use graph templates to standardize report visuals.
4. Practical Applications of Excel and SPSS in Data Analysis
4.1 Healthcare Analytics
- Excel: Manage patient data and create dashboards for hospital performance.
- SPSS: Perform survival analysis and identify trends in clinical trial data.
4.2 Marketing Insights
- Excel: Analyze customer demographics and sales performance.
- SPSS: Segment customers and predict purchasing behavior using regression models.
4.3 Academic Research
- Excel: Collect and organize survey responses.
- SPSS: Test hypotheses and validate research findings with statistical tests.
5. Integrating Excel and SPSS for Comprehensive Analysis
5.1 Data Preparation in Excel
- Use Excel for cleaning and organizing data, leveraging functions like CONCATENATE and TRIM.
5.2 Exporting Data to SPSS
- Save Excel files as CSV or XLSX for easy import into SPSS.
- Define variable attributes in SPSS for accurate analysis.
5.3 Combining Results
- Use Excel to visualize outputs from SPSS analyses, creating professional reports and dashboards.
6. Tips for Mastering Excel and SPSS for Data Analysis
6.1 Develop a Systematic Approach
- Clean and prepare data in Excel before performing advanced statistical tests in SPSS.
6.2 Practice Regularly
- Work on real-world datasets to build familiarity with both tools.
6.3 Learn Syntax in SPSS
- Automate repetitive tasks and gain more control over your analysis.
6.4 Stay Updated
- Keep up with the latest features in Excel (Office 365) and SPSS (newer versions) for enhanced functionality.
7. Why Choose Ekundayo Educonsult for Data Analysis Training?
7.1 Expert-Led Courses
Our courses are designed and delivered by professionals with extensive experience in data analytics.
7.2 Comprehensive Curriculum
Learn everything from basic Excel functions to advanced SPSS statistical modeling techniques.
7.3 Hands-On Learning
Work on practical projects and case studies to apply your skills in real-world scenarios.
7.4 Flexible Learning Options
We offer online, hybrid, and in-person training sessions tailored to your schedule.
7.5 Certification
Earn a globally recognized certification in data analysis, boosting your resume and career prospects.
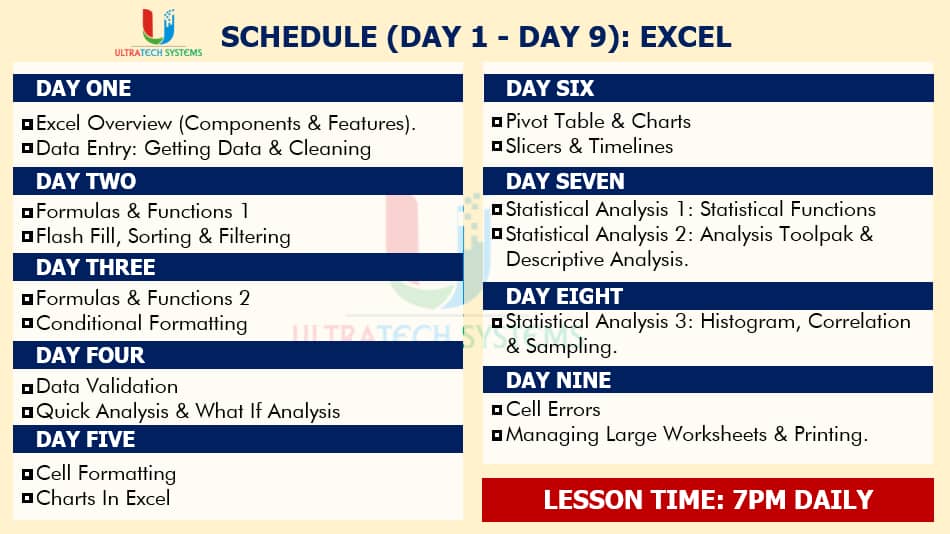
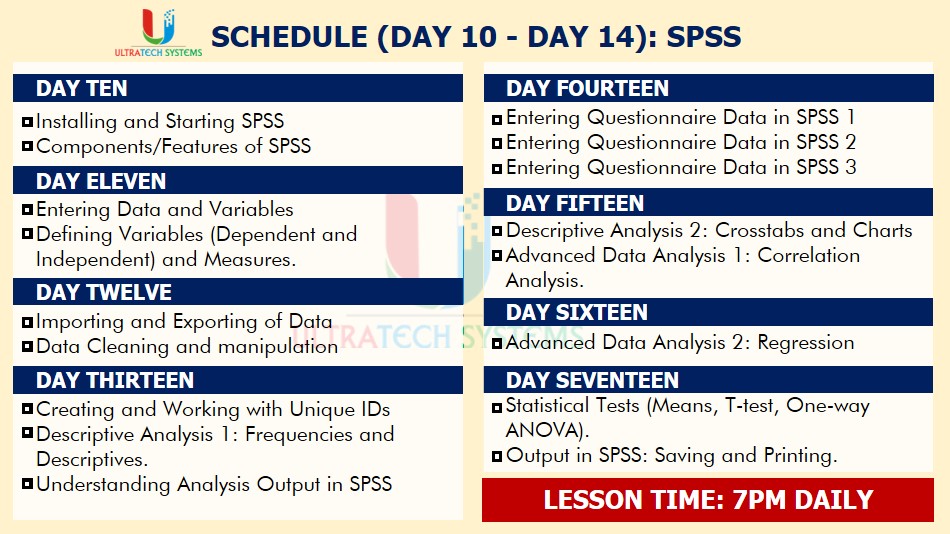
8. Course Outline: Data Analysis with Excel and SPSS
Module 1: Data Analysis Fundamentals
- Introduction to data types and structures.
- Overview of Excel and SPSS interfaces.
Module 2: Data Preparation and Cleaning
- Data formatting, sorting, and filtering in Excel.
- Variable definition and value labeling in SPSS.
Module 3: Descriptive Statistics
- Excel: AVERAGE, STDEV, and COUNTIF functions.
- SPSS: Frequency tables and summary statistics.
Module 4: Inferential Statistics
- Excel: Hypothesis testing with Data Analysis ToolPak.
- SPSS: Conducting t-tests, ANOVA, and chi-square tests.
Module 5: Data Visualization
- Excel: Creating dashboards and pivot charts.
- SPSS: Generating histograms and scatterplots.
Module 6: Advanced Topics
- Regression analysis and predictive modeling in SPSS.
- Automating workflows with SPSS syntax and Excel macros.
Conclusion
Data analysis is a critical skill for professionals across industries, and mastering both Excel and SPSS gives you a significant edge. Excel provides versatility and ease of use for data preparation and visualization, while SPSS excels in advanced statistical analysis.
Ekundayo Educonsult offers comprehensive training in Excel and SPSS, empowering you with the knowledge and confidence to tackle any data challenge. Enroll today to take your data analysis skills to the next level!
